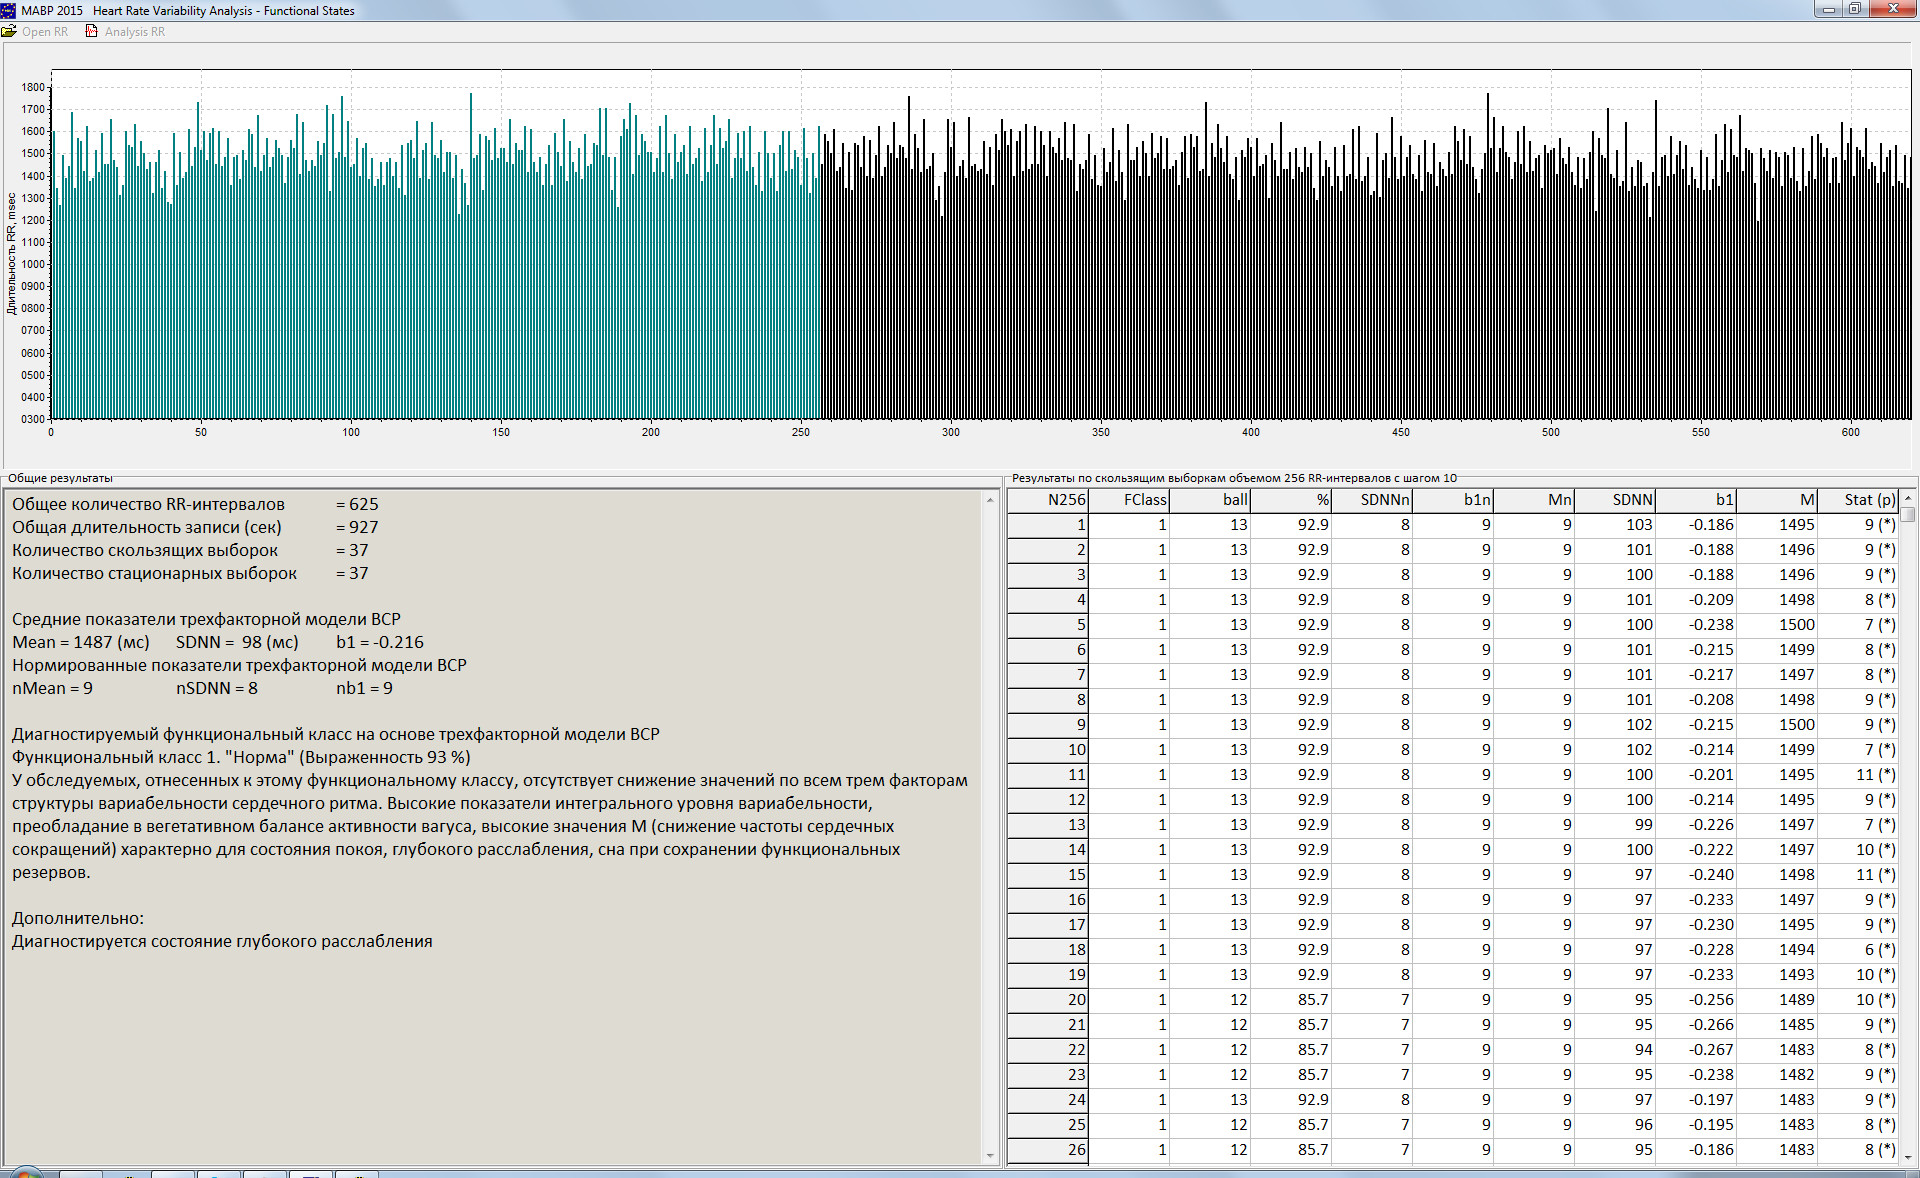
MAVR.HRV - The demonstration program for the diagnosis of human functional state, based on the Three-factor model of Heart Rate Variability (Delphi 7). Mashin V.A., 2015.
Download R-R intervals from the files on the disk and build rhythmogram.
Analysis of the indicators of HRV Three-factor model for moving samples (256 R-R intervals and with a step 10 R-R intervals) with preliminary removal of the linear trend and evaluation process is stationary.
Determination of functional class and severity based on normalized indicators of HRV (SDNN, b1, Mean).
Building a table of analysis results for moving samples: HRV indicators, normalized HRV indicators, functional class and severity, evaluation of stationarity.
Output in the text box of the general analysis results of HRV Three-factor model indicators for moving stationary samples with a brief description of the final functional class.
MABP.PartCor - The program for calculation of Partial Correlations and KMO-test. Mashin V.A.
DownLoad MABP.PartCor v.1.01 (2009) Freeware. (MABP.PartCor.zip - 199 Kbt)
The program and Source Code (Delphi) for calculation of Partial Correlations (parent matrix - matrix of correlation coefficients) and
Kaiser-Meyer-Olkin Measure of Sampling Adequacy (KMO) for Factor Analysis. Screenshot of MABP.PartCor.
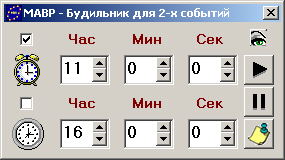
MABP.Alarm - The program of Alarm Clock (Borland Delphi 5). Mashin V.A.
DownLoad MABP.Alarm v.1.03 (2012) Freeware. (MABP.Alarm.zip - 218 Kbt) DownLoad Default.mp3 Freeware. (Default.mp3.zip - 1.146 Kbt). Can be replaced by any other mp3-file.
The program allows you to set two alarm time. Clock alarm tone - any mp3-file with name "Default.mp3". After setting the alarm, the program can hide in the tray.
Screenshot of MABP.Alarm.
MABP.ICO-BMP - The program for transformation of ICO-files in BMP format and BMP-files in ICO format (Borland Delphi 5). Mashin V.A.
DownLoad MABP.ICO-BMP v.1.02 (2007) Freeware. (MABP.ICO-BMP.zip - 153 Kbt)
The program work with BMP and ICO images (32x32 and 16x16). The size of source BMP-file is not important. There is function for choice of transparent color of BMP-files. Tested for WinMe и Win2000. Screenshot of MABP.ICO-BMP.
MABP.OptimHTML - The program for optimization of code of HTML-pages after MS Word, FrontPage, Dreamweaver and other WYSWYG-editors
(Borland Delphi 5). Mashin V.A.
Optimization HTML-code according to standard set of conditions (for MS Word HTML-pages).
File -  330 Кbt, N changes -   4017, Time of processing* -        10 sec, Optimization - 65%.
File - 1650 Кbt, N changes -  21406, Time of processing* -  2 min 06 sec, Optimization - 52%.
File - 6921 Кbt, N changes - 105994, Time of processing* - 27 min 01 sec, Optimization - 63%.
Possibility for making of new condition for optimization HTML-code on the basis of 5 basic rules.
Possibility for step-by-step optimization HTML-code (for checking of new condition).
MABP.DBase-PFO - Program for entering, editing, analysis and making up the psychological conclusions on results of the examinations. Mashin V.A.
Short Help of Program MABP.DBase-PFO v.2.01 - 20.01.2004. [WinHelp, in Russian]
The process of the psychological support to activity of professionals (the selection, the current examinations) requires from psychologist the analysis of dynamics of test individual results, the compare test individual results to referent sample results, the building of the psychological conclusion on base of the analysis. For this purpose us was designed the progarm MABP.DBase-PFO v.2.01, in which are solved put above problems: entering, editing, analysis and making up the psychological conclusion on results of the examinations.
Source information is kept in format Microsoft Access-2000. The Database is designed by Delphi-5. The data access is realized by means of component ADO (MDAC versions 2.5). Screenshot of MABP.DBase-PFO program (1). Screenshot of MABP.DBase-PFO program (2).
MABP.DBase-HRV - Program for entering, editing, analysis and making up the psychophysiological conclusions on results of the examinations. Mashin V.A.
Import R-R intervals from files on disk in MSDOS-format and Varicard-format as in the individual mode (separate record or fragment of record), so and in stream mode (simultaneous processing the array of the records and fragments).
Creation database, keeping and editing R-R intervals (graphic and numeric editors) and marks event.
Mathematical analysis and calculation of the heart rate variability (HRV) indexes as in the individual mode (on the whole record or selected fragment), so and in stream mode (simultaneous processing the array of the records, keeping or in database, or in file on disk).
Export results of analysis on subject group in "Statistica for Windows 6.0" for following statistical analysis.
Graphic presentation results of analysis (track record of the indexes, correlation the different parameters).
Writing of the conclusions on results psychophysiological examinations.
MABP.Chaos - Program for graph mapping and analysis of nonlinear dynamics measurements of difference processes (Borland Delphi 5). Mashin V.A.
Purpose of the Program MABP.Chaos v.4.01
Process modeling: Real R-R data + Gaussian Noise, White Noise, Gaussian Noise, Gaussian autoregression, NLMA, Autoregression (ARCH), Autoregressive moving average (ARMA), Random walk, Harmonic oscillations (3 frequencies), Two Tours, Three Tours, Lorenz attractor, ARDMG4, Mackey-Glass Data, Iceda map, Generalised Brownian motion, Generalised Brownian Noise, Rossler attractor, Veirshtrasse-Mandelbrot function, Generator VanDer Poly, Logistic, Fractal, Henon map, Saw-tooth map, Tent map, Recursion Feigenbaum, Arnold function.
Plotting of a graphs: {Xi}, {Xi,Xi+step}, dynamics of nonlinear and linear measurements.
Calculation of measurements: Largest Lyapunov Exponent (LLE), Correlation Dimension (D2), Time-domain and Frequency-domain measurements, Graph measurements {Xi,Xi+step}, Autocorrelation {Xi,Xi+step}, Nonlinear and linear measurements correlation.
Ravens Progressive Matrices – Diagnosing of abstract thinking.
Screenshot of MABP.Raven program. Screenshot of MABP.ViewResult (Raven) program.
Minnesota Multiphasic Personality Inventory (MMPI) – Diagnosing of personality structure.
Screenshot of MABP.MMPI program. Screenshot of MABP.ViewResult (MMPI - Response Time on Questions) program. Screenshot of MABP.ViewResult (MMPI - Response Time on Scales) program.
Californian Psychological Inventory (CPI) - Diagnosing of personality structure.
Screenshot of MABP.CPI program. Screenshot of MABP.ViewResult (CPI - Response Time on Questions) program. Screenshot of MABP.ViewResult (CPI - Response Time on Scales). Screenshot of MABP.Analysis (CPI) program.
Methods for analysis of motivational structure of working activity (Kocurina I.G.)
"360 degrees" (16) - Methods for performance appraisal on basis of the competency model of NPP managers (Nuclear Electric Ltd., UK).
Screenshot of MABP360man.exe (Start). Screenshot of MABP360man.exe (Estimation).
"360 degrees" (16) - The program for analysis of performance appraisals on basis of the competency model of NPP managers (Nuclear Electric Ltd., UK).
Screenshot of MABP360ann.exe - Plot of estimations. Screenshot of MABP360ann.exe - Estimations analysis.
Expert (Group) Judgements - The program for analysis of expert (group) data: assessing the expert competence and the generalized estimation of objects on binary matrix of responses, building the generalized ranking of objects (Borda Method, Condorcet Principle, Kemeny Median, Majority Method), assessing agreement among experts (Kendall's dispersion coefficient of concordance subject to connected ranks, entropic coefficient of concordance), assessing the rank correlation coefficients (Kendall tau and Spearman subject to connected ranks). Interactive exclusion of expert estimations from analysis in terms of competence values.
The analytic hierarchy process (Saaty T.L.) by example of performance appraisals of NPP managers - The analysis of paired comparisons matrix for the double-level hierarchy: NPP managers competences (criterions), NPP managers (subjects - alternatives).
Screenshot of MABP.AHP.Comp_Comp program - The building matrix of paired comparisons for criterions (competences). Screenshot of MABP.AHP.Comp_Sub program - The building matrix of paired comparisons for subjects (NPP managers) in terms of criterions (competences). Screenshot of MABP.AHP.Analysis program - The analysis of paired comparisons matrix for estimation of priorities (performance appraisals) of NPP managers in terms of criterions (competences).
Belbin Test - Diagnosing of personal role favours in group.
Method of sociometrics - Estimation of sociometric status, emotional effusiveness, pshycological solidarity (mutuality) and antipathy, interactive construction of sociogram.
Semantic Differential (Ch.Osgood) - Diagnosing of motivational structure of personality.
Screenshot of MABP.Osgood program. Screenshot of MABP.Osgood program.Analysis (Results, Random Data). Screenshot of MABP.Osgood program.Analysis (Plot, Random Data).
Repertory Grid Technique - The expert evaluation of manager performance appraisals on basis of the G.A.Kelly method.
Screenshot of MABP.Kelly.exe - Elicit of Constructs. Screenshot of MABP.Kelly.exe - Evaluation of managers on basis of the constructs.
Method of Paired Comparisons - The program for the experts paired comparisons of managers performance effectiveness.
Screenshot of MABP.PairComp.exe - the paired comparisons of manager group. Screenshot of MABP.PairComp.exe - analysis of the experts paired comparisons.
Five-Factor Personality Questionnaire (5PFQ) X.Тsuji (on basis of five-factor model of personality of P.T.Costa & R.R.McCrae). – Diagnosing of personality structure.
Screenshot of MABP.5PFQ.exe. Screenshot of MABP.5PFQ.An.exe - Data Analysis (Factors - T-balls). Screenshot of MABP.5PFQ.An.exe - Data Analysis (Factors - Raw-balls). Screenshot of MABP.5PFQ.An.exe - Data Analysis (Response time).
The questionnaire 'Motivation-to-work Profile' (S.Ritchie, P.Martin) - Identification 12 factors that drive people at work to produce a 'motivation to work' profile.
Screenshot of MABP.12F.exe program - Data collection. Screenshot of MABP.12F.Plot.exe - Data analysis.
The modified questionnaire 'Motivation-to-work Profile' (S.Ritchie, P.Martin) - Identification 12 factors by the method of paired comparisons that drive people at work to produce a 'motivation to work' profile of 'Ideal' and 'Real' works. Analysis of work satisfaction ('real' and 'ideal' work motivation difference).
Screenshot of MABP.12Fmod.exe program - Data collection ("ideal" work). Screenshot of MABP.12Fmod.exe program - Data collection ("real" work). Screenshot of MABP.12Fmod.Plot.exe - Data analysis.
Inventory of D.R.Denison - Analysis of Organizational Culture.
Screenshot of MABP.Denison.exe - Data collection. Screenshot of MABP.Denison.Plot.exe - Individual Data analysis. Screenshot of MABP.Denison.Plot.exe - Group Data analysis.
Inventory MAVR.OCI - Analysis of Organizational Culture: Development (Adaptation, Innovation), Cooperation (Competition, Integration), Motivation (Stimulation, Involvement), Psychological climate (Consensus, Communication).
Screenshot of MABP.OKK.exe - Data collection. Screenshot of MABP.OKK.Plot.exe - Individual Data analysis. Screenshot of MABP.OKK.Plot.exe - Group Data analysis.
To question of the correct using the statistical methods in psychological study
Following questions are сonsidered: Student's t-test, Mann-Whitney U test, Wilcoxon matched pairs test, Pearson Chi-square for Crosstabulation Tables, Factor Analysis, Two-way ANOVA
Analysis of additional indexes of heart rate graph (24.09.2002)
Mashin V.A. Analysis of additional indexes of heart rate graph. - 2002. [in Russian]
The additional indexes of heart rate graph (HRG) are presented: sum of squares of least distances from graph nodes before axis Х (SumX2), sum of squares of least distances from graph nodes before axis Y (SumY2), relation SumX2/SumY2. The aims of this article are to (1) describe the new parameters of HRG, (2) analyze correlation of HRV indexes and new HRG parameters in rest state (N=10036), (3) analyze of relationship SumX2/SumY2 with frequency of harmonic fluctuations and frequency a pica with maximum spectral density, (4) analyze HRG new parameters for different functional states (1 - normal state, 2 - neurotic excitement, 3 - functional fatigue, 4 - psychic strain; on 32 men in group), (5) diagnostics the stationarity of process with help of new HRG indexes.
Researching structure of heart rate graph, we came to conclusion about practicability of consideration of the following additional indexes:
Sum(QX) - sum of squares of least distances from graph nodes before axis Х. (Heart rate graph is inserted in square with side to equal variational range (VR): VR=RRmax-RRmin. The Axis Х is diagonal of square coming from left-lower corner. The Axis Y is diagonal coming from right-lower corner.)
Sum(QY) - sum of squares of least distances from graph nodes before axis Y.
The Square of least distance from graph node before axis Х calculated on formula: QX=0.5*(RR[i]-RR[i+1])^2. Not difficult notice the generality Sum(QX) and RMSSD (Root Mean Sum Successful Deviation) formulas.
The fact that medium of square (in which heart rate graph was inserted) not always comply with mean value of RR-intervals (RRav) was necessary take into account for calculation QY. In other words, there were events, when values of VR/2 were more or less RRav-RRmin. Herewith "center of gravity" of graph was displaced on axis Х or upwards, or downwards from the center of square. With provision for correction on RRav formula for calculation of square of least distance from graph node before axis Y has gained the following type: QY=0.5*(RR[i]+RR[i+1]-2*RRmin-2*RRav)^2.
In table 1 are presented values of Pearson correlation (r) for different indexes of heart rate variability (the registration RR-intervals was conducted in rest state; more full description of procedure a data processing is presented in article Analysis heart rate variability by means of graph method
. N=10036, ln-natural logarithm, HF-power of spectrum of heart rate in high-frequency range, PW-general power of spectrum, SD-standard deviation.
Table 1.
r, p=0.00
lnRMSSD
HF
lnSD
lnPW
Sum(QX)
0.5680
0.9662
0.4796
0.4823
lnSum(QX)
0.9935
0.6494
0.8843
0.8869
lnSum(QY)
0.8287
0.4801
0.9890
0.9835
According to Table 1, sum of squares of least distances from graph nodes before axis Х has very high correlations with tone of parasympathetic nervous system indexes - RMSSD and HF (correlation between lnRMSSD and lnHF is 0.9631). At the same time, sum of squares of least distances from graph nodes before axis Y has very high correlations with the general heart rate variability indexes - SD and PW (correlation between SD^2 and PW is 0.9938, between lnSum(QY) and ln(lnSD) is 0.9920).
The high correlation of relation Sum(QX)/Sum(QY) with HFn (HFn=100*HF/PW) and LF/HF (LF-power of spectrum of heart rate in low-frequency range) indexes logistical was expect. The correlation analysis has confirmed this. The results are presented in Table 2 (PXY=Sum(QX)/Sum(QY)). The high values of correlation for DFA (Detrended Fluctuation Analysis) are presented in addition.
Table 2.
r, p=0.00
HFn
lnHFn
ln(LF/HF)
DFA
lnPXY
0.8560
0.8607
-0.7671
-0.7344
DFA
-0.7369
-0.7574
0.4881
-
On the following step we have calculated the values of PXY index for harmonic fluctuation since different period and amplitude. The analysis has shown presence of relationship PXY with frequency of harmonic fluctuations. The fluctuations since odd periods (for example, 5, 15 sec.) have formed exception that follows from nature of graph (asymmetry of graph comparatively axises X and Y are appeared).
But real heart rate contains the ensemble of dynamic changing fluctuations of different frequency and amplitudes. Following hypothesis was formulated: PXY-index reflects leading (central) fluctuation frequency, having most influence upon heart rate. Spectrograms of RR-intervals were analyzed, frequencies of peaks with maximum spectral density were determined and were compared with PXY for ground of this hypothesis . Correlation between PXY and frequency a pica with maximum spectral density (fmax) though was enough high (r=0.7035, p=0.00), but has required the more detailed analysis of real rhythmograms. This has allowed selecting three variants of relations between PXY and fmax.
1) Exists very high coincidence of PXY and fmax values (for instance, fmax=0.082, PXY=0.080). It is characterized of active rest state (readiness to execution of activity). In this state the high influence of autonomic nervous system (ANS) on heart rate regulation can expect.
2) Growing PXY vastly overtakes the growing fmax (for instance, fmax=0.301, PXY=1.082). Given process is typical for condition of deep relaxation. This is accompanied the reduction role of ANS in heart rate regulation and growing of chaotic nature of process. PXY values strive to 1.0. Exactly such values were received at modeling "white noise".
3) Reduction fmax is accompanied the growing PXY (for instance, fmax=0.016, SD=3257 msec2, PXY=0.328 - chronic overstrain, registration in rest state). Given process is typical for high psychic strain and different pathological processes. It is probably in this case normal regulation of heart rate through ANS becomes impossible, that it is also accompanied the growing of chaotic nature of process, but with very low amplitude (the denominated stabilization of rhythm).
To consider the events, when spectrogram contains the significant peaks in different ranges of frequencies. In this case PXY index presents itself resulting frequencies two fluctuations. For instance, at presence of peaks of spectral density with frequency 0.102 Hz (LF-range, SD=337420 msec2) and 0.207 Hz (HF-range, SD=31345 msec2), PXY value was 0.132 Hz. Note also that PXY index is most sensitive to fluctuations in ranges LF and HF.
For four groups of man: 1 - normal state, 2 - neurotic excitement, 3 - functional fatigue, 4 - psychic overstrain were calculated average values of analyzed graph indexes on each group (Table 3, Nv - number of samples, Sum(QX) and Sum(QY) values are given in msec2).
Table 3.
Group
1
2
3
4
Sum(QX)
345576
105006
21754
3626
Sum(QY)
853916
1803629
91319
25783
PXY
0.408
0.055
0.270
0.1675
Nv
631
1508
452
478
Either as was expected, maximum Sum(QX) value (the indicator to activities of parasympathetic nervous system) was received for first group ("Norma"), and minimum - for fourth group ("Overstrain"). Maximum Sum(QY) value (the factor of general heart rate variability) is characteristic of neurotic excitement (the influence of corticolimbic brain structures systems, note the significant reduction PXY index of leading (resulting) of frequency of fluctuations of heart rate). High PXY value for group "Overstrain" reflects earlier considered dynamic of increasing PXY at reduction fmax for events of rhythm stabilizations.
Use the SumQX, SumQY and PXY indexes in discriminate analysis have allowed greatly to raise accuracy of differential diagnostics presented above functional states.
In conclusion we will afford to return to fact of difference medium of variational range and RRav-RRmin. There are three possible variants:
1) VR/2-(RRav-RRmin)>0 - it is characteristic of for connecting process: fluent (long-time) change one functional state others, firm emotional excitement.
2) VR/2-(RRav-RRmin)<0 - it is characteristic of for violation of heart rate regulation: sharp (short time) change one functional state others, sharp wave of emotional excitement.
3) VR/2-(RRav-RRmin)=0 - it is characteristic of for stationary process.
For validation this hypothesis we have compared own results with standard estimations of stationarity (through checking the constancy of mean and dispersion). The difference between VR/2 and (RRav-RRmin) have expressed in percent from (RRav-RRmin): Dvm=100*(VR/2-(RRav-RRmin))/(RRav-RRmin). For estimation of relations between two categorical variables on criterion Pearson Chi-square we used the registration of RR-intervals in rest state (N=10036). We have calculated stationarity on Dvm when difference did not exceed 1, 2 and 3 percent (Table 4).
Table 4.
Dvm
1%
2%
3%
Pearson Chi-square
2.1558
8.9356
11.0789
p
0.14204
0.00280
0.00087
According to results are presented in Table 4, Dvm index really can serve the estimation of stationarity time series. The analysis of real rhythmogram has shown that choice Dvm=1% brings about more exact diagnostics stationarity than in the event of standard estimation. Certainly, following studies must confirm or refuse our hypothesis.
Heart rate graph
According to studies heart rate graph by means of method a graph (in Russian),heart rate graph is characterized the number of nodes (ND) and ribs (NRib). The decimal logarithm ND is nor than other, as index of system complexity (HmND). Knowing probability of the nodes distribution, easy calculate the index of entropy - the measures of system uncertainty (НND). The relative organization of system (RND) will is: 1 - HND/HmND. Enumerated indexes were calculated both for ND, and for NRib. For four groups: 1 - norm, 2 - neurotic state, 3 - asthenic state, 4 - tensity state the average values were calculated (the sliding 256 RR-intervals samples with a step of 10 RR-intervals were used). Average indexes on each groups are presented in table 1, as well as F-criterion values for analysis of variance (ANOVA, test for evaluation of significant differences between averages). (Nv - number of samples).
Table 1.
Group
HND
HmND
RND
HRib
HmRib
RRib
Nv
1
2.15
2.21
0.029
2.37
2.38
0.004
1042
2
2.05
2.14
0.043
2.29
2.31
0.011
1610
3
1.78
1.90
0.065
2.19
2.24
0.022
441
4
1.25
1.46
0.155
1.62
1.75
0.080
322
F
3800
3815
2508
3350
2752
3225
322
According to table 1, complexity level of system (both on number nodes, and on number ribs) is most high in calm state (norm) and decreases at growing of tensity. The indexes of entropy (the level to uncertainties) and relative organization of system (both on number nodes, and on number ribs) are minimum for first group and maximum for tensity state. In addition the index ND/NRib was calculated. Correlation analysis has revealled the interesting regularity between this index and number of nodes. If for first three groups the values of r (Pearson coefficient of correlation) indicated to high positive coorelation between ND and ND/NRib (0.98, 0.94 and 0.87, accordingly), then for tensity state r=-0.75. This possible comment as follows: in usual conditions a growing or reduction of ND is accompanied the identical growing or reduction of NRib. In tensity state, reduction of ND is accompanied comparatively more denominated reduction of NRib.In the future is planned to continue the studies of heart rate graph indexes by means of discriminant analysis.
Detrended Fluctuation Analysis
One of the methods of nonlinear estimation serves Detrended Fluctuation Analysis (DFA is quantify the fractal correlation properties of time series, Peng et al. 1995). In article
Peng C-K, Hausdorff JM, Goldberger AL. Fractal mechanisms in neural control: Human heartbeat and gait dynamics in health and disease. In: Walleczek J, ed. Nonlinear Dynamics,
Self-Organization, and Biomedicine. Cambridge: Cambridge University Press, 1999. is kept enough full description DFA. But for calculations better to use the programs were kindly given by authors: the detrended fluctuation analysis (DFA) software package.
(Except programs, zip-file contains the source texts in C-code.) Recent studies have shown that calculated by means of procedures DFA index alfa in norm is aproximately 1.00, reduction for patients with cardiovascular disorders, but increase for elderly people (Peng et al. 1995, Ho et al. 1997, Hausdorff et al. 1995, Iyengar et al. 1996). But note that these results were received for long-term records of RR-intervals (24 hours).
Using data on next groups: 1 - norm, 2 - neurotic state, 3 - asthenic state, 4 - tensity state, alfa indexes were calculated on procedure DFA for short-term records (the sliding 256 RR-intervals samples with a step of 10 RR-intervals were used). Then correlations of alfa with variables of statistical and spectral analysis, as well as heart rate graph indexes were counted for each group. The significant positive correlation (p=0.000) alfa with normalized values of power spectrum in а very low-frequency (VLFn=100*VLF/TP, TP - overall power of heart rate spectrum, in msec2) was discovered. In table 2 the average alfa indexes, r - values of Pearson correlations between alfa and VLFn, as well as number of samples on each group (Nv) were brought.
Table 1.
Group
alfa
r
Nv
1
0.688
0.93
1042
2
1.086
0.78
1610
3
0.820
0.89
441
4
0.921
0.52
322
From tables 1 is seen that reduction of tensity is connected with a decrease of alfa (to 0.5). In tensity state alfa approaches to 1.00. In neurotic state alfa exceeds 1.00.
The values of alfa and VLFn have a high positive correlation (the increase of VLFn-values are connected with growing of alfa) for all groups, except fourth.
In tensity state a correlation between alfa and VLFn sharply falls (the dependency between variables becomes not obvious). Curiously enough note that alfa has negative correlation (but more denominated) with HFn (HFn = 100*HF/TP).
According to ANOVA analysis (on four groups) for alfa F=2214, for NRib F=4468, for ND F=3814.
Hereinafter the studies of possibility of using DFA on short samples for differential diagnostics of different functional conditions is planned to continue.